
Figure 4.
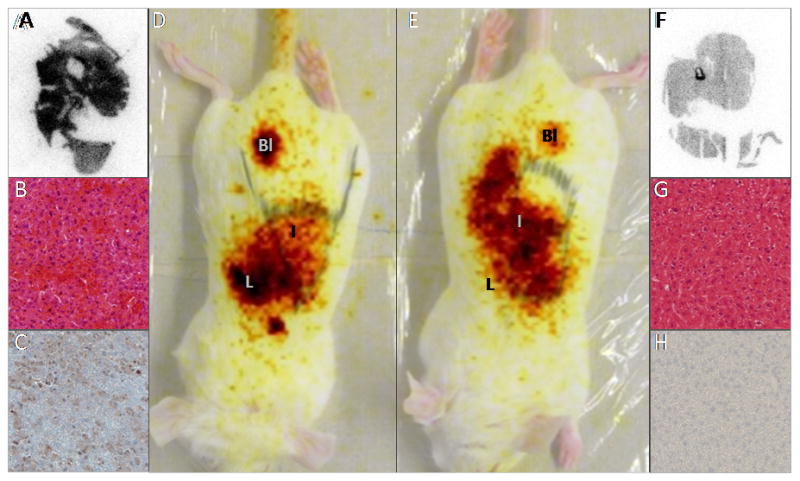
Planar images 50 min after 99mTc-HYNIC-1 injection in anti-Fas treated (D) or normal mice (E). Liver, intestines and bladder are indicated by L, I and Bl. 60 min pi livers were excised, and analyzed by autoradiography (A: anti-Fas treated, F: normal), H&E (B:anti-Fas treated, G: normal) and immunostaining (C: anti-Fas treated, H: normal) using an anti-cleaved caspase-3 mAb (brown color in C).