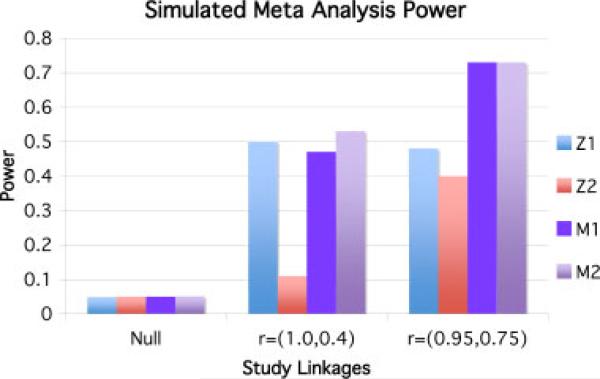
Fig. 1.
Power of simulated studies. Z1 is the power of study 1, Z2 is the power of study 2, M1 is the power of the WSoZ method, and M2 is the power of the imputation aware meta-analysis method. In the Null example, the genotypes are completely unlinked to the causal variants in both studies 1 and 2. In the second example, study 1 genotypes the causal variant directly and study 2 imputes it with r = 0.4. In the third example, study 1 and study two both impute the SNP with r = 0.95 and r = 0.75, respectively. Notice that the imputation aware meta-analysis method matches or beats the power of the traditional method in each case, and that in the second example the power actually drops in the traditional method due to poor imputation quality that is not accounted for in the second study. SNP, single nucleotide polymorphism; WSoZ, weighted sum of z-scores.

