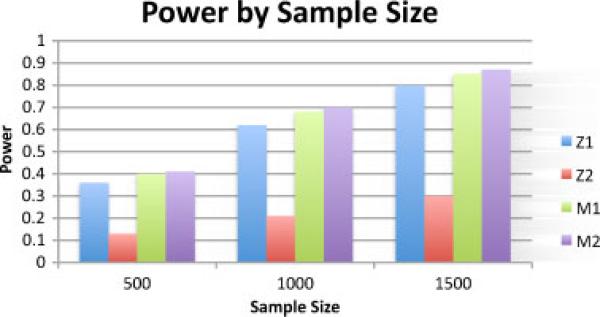
Fig. 2.
Power of simulated meta-analysis studies under various sample sizes. Z1 is the power of study 1, Z2 is the power of study 2, M1 is the power of the WSoZ method, and M2 is the power of the imputation aware meta-analysis method. The genotypes are linked to the causal variants with r = 0.4 in study 1 and r = 0.8 in study 2. The sample size is the number of cases in balanced case-control study. For the entire range, the imputation aware meta-analysis beats the power of the WSoZ method showing the result is robust across variations in sample size. SNP, single nucleotide polymorphism; WSoZ, weighted sum of z-scores.

