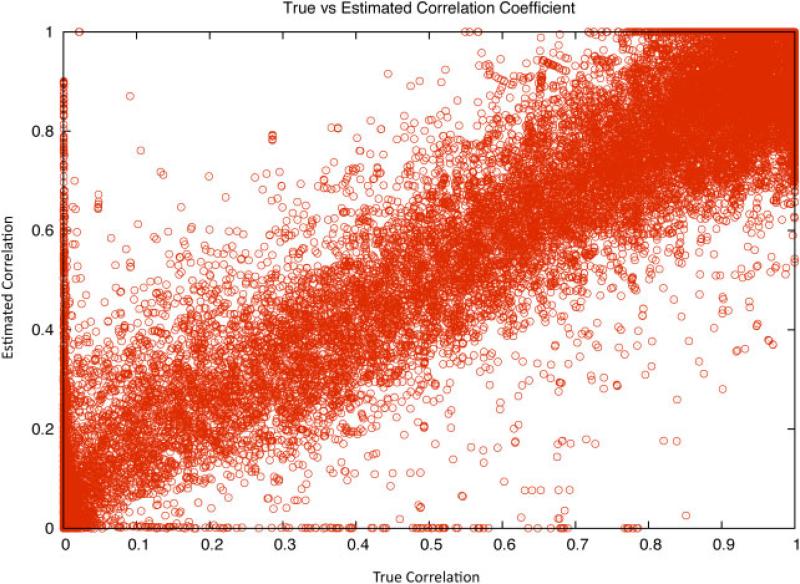
Fig. 3.
Plot of the true correlation coefficient r2 versus the estimated correlation coefficient r2 of imputed SNPs in the WTCCC controls. The estimated and true correlation coefficients are highly correlated with r = 0.95 showing that the estimate is accurate. For SNPs with low minor allele frequency, the estimates of r2 are not reliable. SNP, single nucleotide polymorphism; MAF, minor allele frequency.

