Fig. 5.
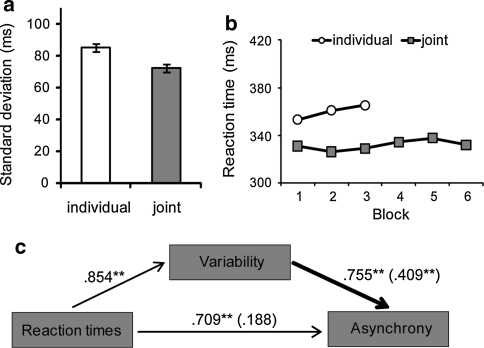
Results of Experiment 3 (sequential coordination). a Leaders’ reaction times were less variable (reduced standard deviation) in the joint condition than in the individual condition. Error bars display within-subject confidence intervals (Loftus and Masson 1994). b Reaction times of the leader were faster in the joint compared with the individual condition. c Zero-order correlations showed that the asynchrony between leaders’ and followers’ responses was positively correlated with the standard deviation and mean reaction times of the leader. Moreover, partial correlations (in brackets) indicate that the leader’s response variability had a direct influence on asynchrony (thick black arrow), whereas speeding supported coordination only indirectly (significance levels: *P < .05; **P < .001)

