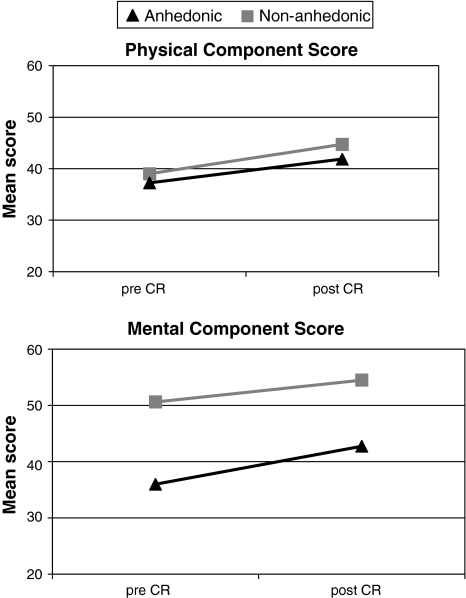
Fig. 2.
Mean health status scores pre- and post-CR stratified by anhedonia. MANOVA with repeated measures. A high score represents better health status. Note: SDs range from 6.94 to 11.24. Main effect for Time F(1,357) = 10.84, P = .001; Main effect for Anhedonia F(1,357) = 34.80, P < .001; Interaction for Time*Anhedonia F(1,357) = .23, P = .63. CR Cardiac rehabilitation

