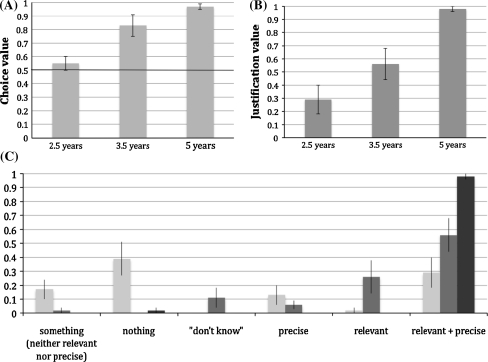
Fig. 2.
a Shows the average choice value (i.e., average correct choice) for the 2.5-, 3.5-, and 5-year-old children. Error bars indicate standard error of the means. The bold horizontal line emphasizes the 50% value (i.e., chance performance). b Shows the average justification value for the 2.5-, 3.5-, and 5-year-old children. Error bars indicate standard error of the means. c Gives a more detailed overview over the different categories of answers provided by the 2.5-, 3.5-, and 5-year-old children in the justification question. The light gray bar represents the performances of the 2.5-year-old children, the intermediate gray bar represents the performances of the 3.5-year-old children, and the dark gray bar represents the performances of the 5-year-old children

