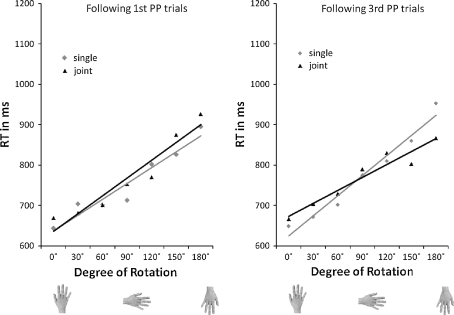
Fig. 6.
Reaction times and linear fits for both attention conditions in experiment 3. Left Preceding trial showed first-hand picture from the first-person perspective. Right Preceding trial showed first-hand picture from the third-person perspective. The single-attention condition is depicted in grey (squares), the joint-attention condition in black (triangles). The linear trend line for the single condition is depicted in grey, R 2 = .92 for trials following first-person perspective trials (left) and R 2 = .97 following third-person perspective trials (right). The linear trend line for the joint condition is shown in black, R 2 = .93 following first-person perspective and R 2 = .93 following third-person perspective trials

