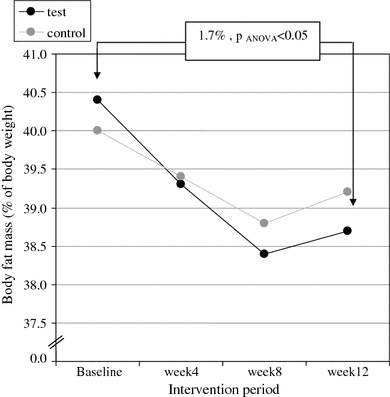
Fig. 2.

Change in body fat mass (% of body weight for the test and control groups during treatment). Values are means. p < 0.05 over time difference from baseline compared to week 12 (repeated measurement ANOVA)

Change in body fat mass (% of body weight for the test and control groups during treatment). Values are means. p < 0.05 over time difference from baseline compared to week 12 (repeated measurement ANOVA)