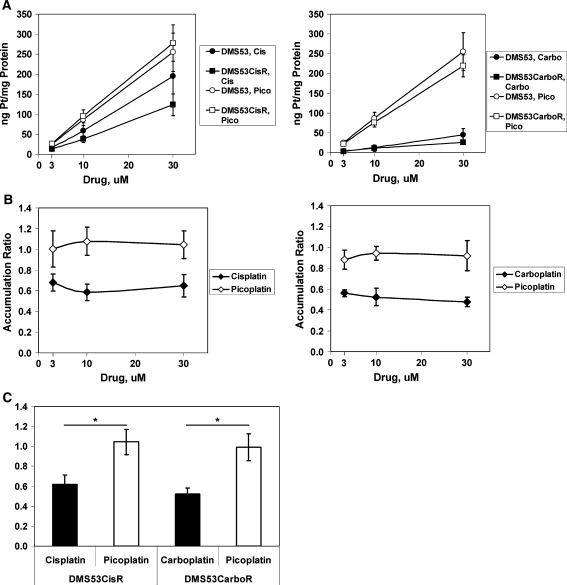
Fig. 2.
Total cellular platinum accumulation in parental and drug-resistant DMS53 cells. a Cellular platinum levels versus drug concentration. Attached cells were treated with drug (3, 10, and 30 μM) for 24 h, and lysates were harvested and analyzed by ICP-MS. Platinum levels were normalized to protein concentration for each sample. b Accumulation ratio is calculated by dividing the amount of platinum per mg of protein for the resistant cells by that of the parental cells. A ratio of one indicates that there is no difference in platinum accumulation between resistant and parental cells whereas a value of less than one represents reduced platinum accumulation in resistant cells. c Average accumulation ratio was obtained by averaging the ratios of the 3 concentrations tested for each drug. This was possible because the accumulation did not change over the drug concentration range used. Filled symbols = selection drug; Open symbols = picoplatin. CisR = cisplatin-resistant line; CarboR = carboplatin-resistant line. Data are the average of 3 independent experiments. Error bars represent the standard deviation for each data point. *p < 0.000025, Student’s t-test, two-tailed

