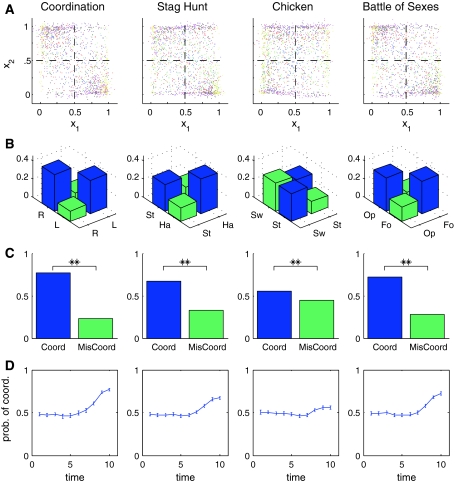
Fig. 3.
a Endpoint distributions of the four different games for all players. The x 1-position corresponds to the final position chosen by Player 1 and the x 2-position to the final position of Player 2. The six different colors correspond to the six different subject pairs. b The distribution of the endpoints was binned into the four quadrants corresponding to the two times two actions of the respective discrete game. The quadrants in the coordination game correspond to the actions left (L) and right (R). The quadrants in the stag hunt game correspond to the actions stag (St) and hare (Ha). The quadrants in the chicken game correspond to the actions swerve (Sw) and stay (St). The quadrants in the battle of sexes game correspond to football (Fo) and opera (Op). c Histogram over coordinated versus miscoordinated solutions. In all games and conditions, there was a significantly higher frequency of the coordinated outcomes. The two stars indicate a significance level of P < 0.01 in a Wilcoxon ranksum test over the six different games. d Temporal evolution of coordination probability. Trajectories were binned into 10 equidistant points. The coordination probability is given by the fraction of trajectory points that lie in the two quadrants corresponding to successful coordination. The error bars are obtained by bootstrapping

