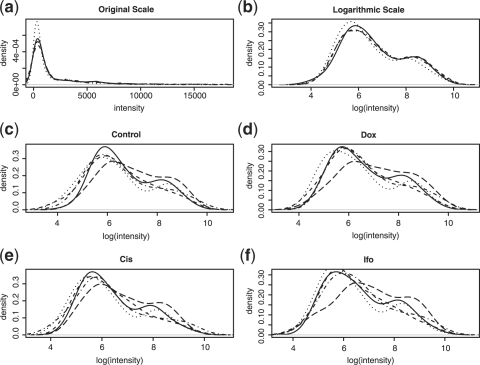
Fig. 1.
All results are based on the experimental data for one specimen. Plot (a) shows the original intensity distributions of the four samples (before normalization). Plot (b) shows the logarithmic intensity distributions of the four samples (before normalization). Each of plots (c) through (f) shows the logarithmic intensity distributions of the five subprofiles of the four samples.

