
Fig. 6.
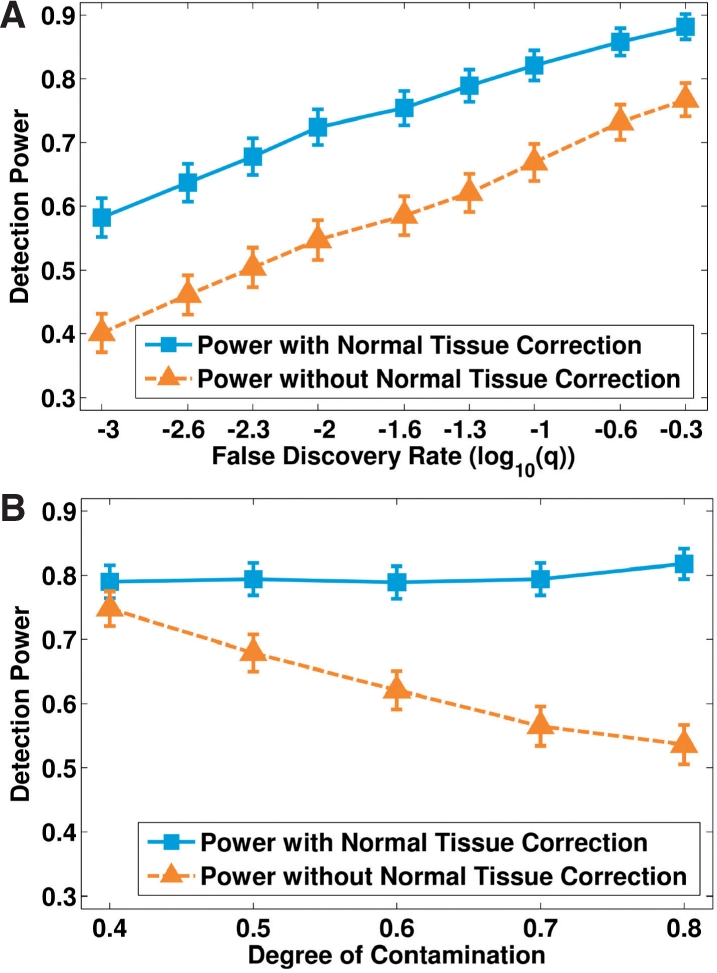
A comparison of the power to detect significant consensus events with and without correction of the normal tissue contamination, along (A) different false discovery rates (FDRs) and (B) different degrees of contamination.
Official websites use .gov
A
.gov website belongs to an official
government organization in the United States.
Secure .gov websites use HTTPS
A lock (
) or https:// means you've safely
connected to the .gov website. Share sensitive
information only on official, secure websites.
A comparison of the power to detect significant consensus events with and without correction of the normal tissue contamination, along (A) different false discovery rates (FDRs) and (B) different degrees of contamination.