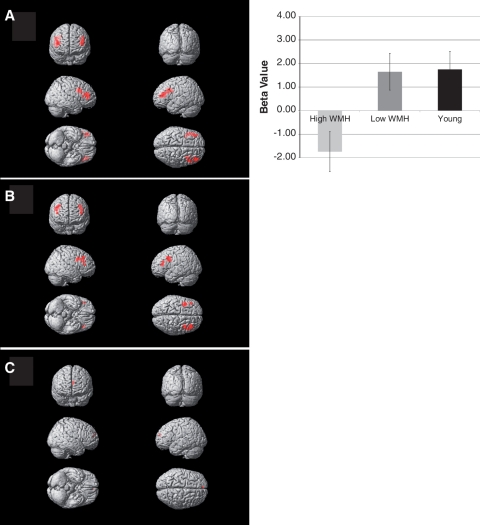
Figure 4.
Dorsolateral prefrontal cortex region of interest analysis in (A) young subjects, (B) older subjects with minimal white matter hyperintensity and (C) older subjects with severe white matter hyperintensity. Chart shows group differences in mean beta values over dorsolateral prefrontal cortical region of interest (shown in Fig. 1) during ‘B’ cue relative to ‘A’ cue. Young and older subjects with minimal white matter hyperintensity had significant activation relative to older subjects with severe white matter hyperintensity (P < 0.05, post hoc t-test).

