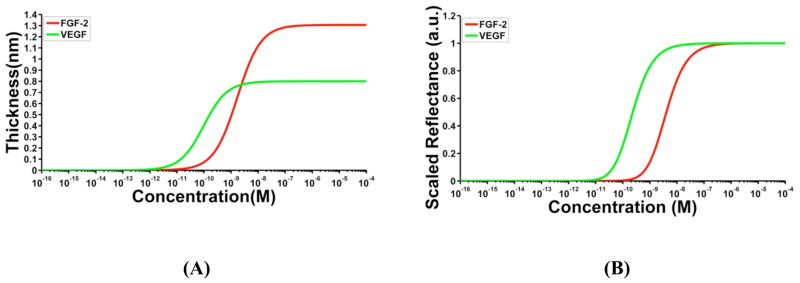
Figure 1.
Simulated binding curves. (A) One-site Langmuir curves depicting the 1:1 binding interaction of FGF-2 (red) and VEGF (green) with their respective antibodies simulated using equation 3a. The maximum thicknesses (tmax) for FGF-2 and VEGF used in the simulations were determined using spectroscopic ellipsometry to be 1.3 nm and 0.8 nm, respectively. Dissociation constants of 1.6 nM and 100 pM, as determined by SPR, were used in the simulations for FGF-2 and VEGF, respectively. (B) AIR response curves for FGF-2 and VEGF were simulated by incorporating the 1:1 Langmuir model into the AIR thickness-dependent reflectance model. Raw reflectance values from the simulation were scaled between 0 and 1.

