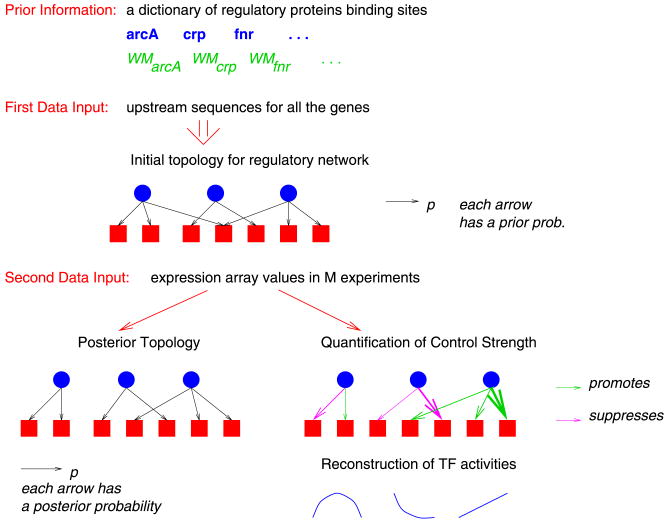
Fig. 2.
Transcription network reconstruction integrating DNA sequence and gene expression information. Blue circles represent regulatory proteins and red squares genes. An arrow connecting a circle to a square indicates that the transcription factor controls the expression of the gene. When different colors are used in depicting these arrows, they signify a different qualitative effect of the TF on genes (repressor or enhancer). Finally, varying arrow thickness signifies different control strengths.

