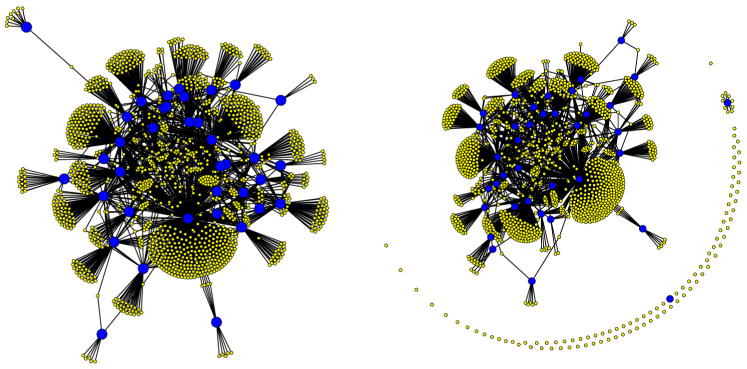
Fig. 4.

Prior network (left) and posterior estimate produced using the ungrouped method (right). The large blue circles correspond to the 37 transcription factors while the yellow circles represent the 1433 genes. The lines joining blue and yellow circles indicate network connections.
