Figure 5.
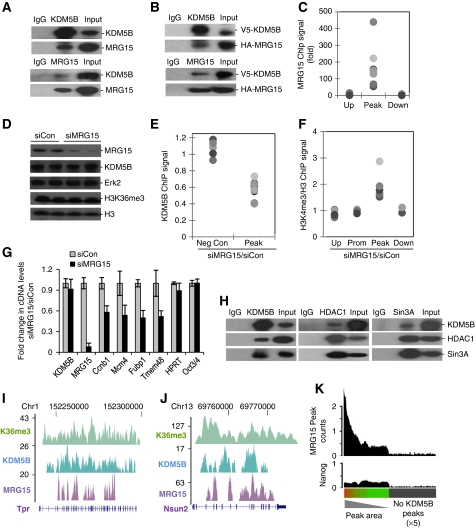
MRG15 mediates recruitment of KDM5B. (A, B) Endogenous (A) or epitope-tagged (B) KDM5B and MRG15 immunoprecipitates from ESCs were immunoblotted with the indicated antibodies. (C) ChIP-PCR analysis of MRG15 occupancy at KDM5B peaks (Peak) and control regions (Up and Down). (D) Immunoblot analysis of KDM5B and MRG15 from ESC whole cell extracts following MRG15 knockdown (siMRG15). (E, F) KDM5B or H3K4me3 ChIP-PCR analysis at negative control regions (Up and Down) and KDM5B peaks following MRG15 knockdown (siMRG15). Data are expressed as the ratio of ChIP signal from siMRG15 over siCon. Each dot represents a distinct ChIP-Seq locus and pairwise comparisons to Peak data P<0.01. (G) RT–PCR analysis of randomly picked KDM5B target genes (Ccnb1, Mcm4, Fubp1, Tmem48) and control (HPRT, Oct4) following siRNA-mediated MRG15 knockdown. (H) KDM5B, HDAC1, and SIN3A immunoprecipitates from ESCs were immunoblotted with the indicated antibodies. (I, J) UCSC genome browser tracks depict H3K36me3, KDM5B, and MRG15 ChIP-Seq peaks at representative gene loci. The numbers on the left axes indicate peak amplitude. (K) Histogram depicting MRG15 and Nanog (control) ChIP-Seq peak density in RefSeq genes rank ordered by KDM5B peak area. The grey bar indicates genes without KDM5B peaks (× 5 scaling).

