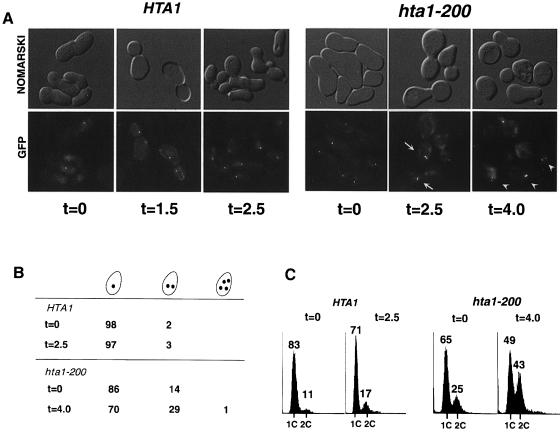
Fig. 6. Sister chromatid separation in the hta1–200 mutant. Newly germinated wild-type HTA1 and hta1–200 cells were scored for sister chromatid separation and DNA content during a single cell cycle. (A) Phenotypes of HTA1 and hta1–200 cells released from α–factor arrest at 30°C (t = 0) and observed after one generation time (1.5 and 2.5 h, respectively) and 1.7 generation times (2.5 and 4.0 h, respectively). These strains carry lactose operators integrated near the centromere of chromosome III. CEN3 was visualized by fluorescence microscopy after induction of GFP–lacI. At the beginning of the cycle (t = 0) the unbudded cells contain one GFP dot representing the unreplicated chromosomes. By the end of the cycle HTA1 cells have separated their sister chromatids to opposite poles (t = 1.5), while hta1–200 cells contain cells where both sisters separate at one pole (t = 2.5, arrows). After completion of cytokinesis HTA1 cells contain single dots (t = 2.5), while hta1–200 cells contain both sisters (t = 4.0, arrowheads). (B) Single cells containing one, two or four GFP dots were scored at the beginning and end of the cycle. At least 200 cells were scored for each time point. Cells with no GFP signal (aploids) were not scored. Numbers represent percentage values of total cells with GFP signal. (C) DNA content of the samples used in (A) and (B) was analyzed by flow cytometry.

An official website of the United States government
Here's how you know
Official websites use .gov
A
.gov website belongs to an official
government organization in the United States.
Secure .gov websites use HTTPS
A lock (
) or https:// means you've safely
connected to the .gov website. Share sensitive
information only on official, secure websites.
