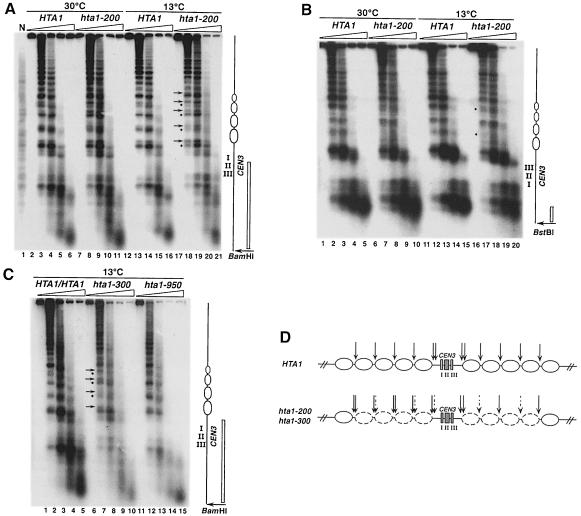
Fig. 8. The hta1–200 and hta1–300 mutants have altered chromatin structure over the CEN3 region. Nuclei were isolated from wild-type haploid, diploid and hta1 mutant strains after growth at permissive (30°C) or restrictive (13°C for 24 h) conditions, digested with increasing concentrations of MNase and subjected to indirect end-labeling analysis as described in Materials and methods. (A and C) BamHI-digested DNA hybridized with a radiolabeled 616 bp DNA fragment adjacent to the restriction site. (B) BstBI-digested DNA hybridized with a radiolabeled 173 bp DNA fragment adjacent to the restriction site. Positions of the CEN3 nuclease-resistant core and the flanking nucleosomes altered in the mutant are indicated in the diagram to the right. Positions of the probes are indicated as open bars. Arrows and bullets represent enhanced and diminished MNase digestion in the hta1–200 and hta1–300 mutants, respectively, compared with wild type. Strains are as follows: N, naked DNA from FY604, HTA1 (FY604), HTA1/HTA1 (FY604/FY605), hta1–200 (FY987), hta1–300 (FY988) and hta1–950 (FY990). Strains FY987 and FY988 are homogeneous diploid populations. (D) Summary of the MNase digestion pattern shown by the hta1–200 and hta1–300 mutants at the CEN3 locus. Dashed arrows represent diminished digestion and thicker arrows represent enhanced digestion. The eight nucleosomes altered in the hta1 mutant are depicted by dashed ovals.

An official website of the United States government
Here's how you know
Official websites use .gov
A
.gov website belongs to an official
government organization in the United States.
Secure .gov websites use HTTPS
A lock (
) or https:// means you've safely
connected to the .gov website. Share sensitive
information only on official, secure websites.
