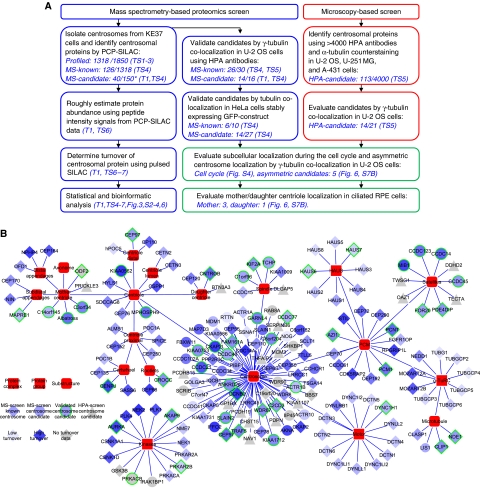
Figure 1.
Mapping the centrosome proteome. (A) Schematic outline of the mass spectrometry and microscopy-based screens carried out to identify and characterize candidate centrosomal proteins. In the MS-screen (left), centrosomal proteins were identified by the PCP-SILAC method (see Figure 2) and validated by co-localization experiments using antibodies and GFP-tagged proteins. In the HPA-screen (right), images of three different cell lines were evaluated for centrosomal staining using human protein atlas (HPA) antibodies. In follow-up experiments, we estimated the abundance, measured the turnover, and determined the subcellular localization of the identified proteins. The number of ‘profiled’ proteins refers to those quantified in all fractions out of those quantified in at least one fraction. The number of ‘MS-candidate’ and ‘MS-known’ refers to those annotated as novel or known centrosomal proteins, respectively, out of those scored as centrosomal proteins by the PCP-SILAC method (*) or those tested by microscopy. References to the relevant tables and figures are shown in brackets. (B) Dynamic protein localization network of the identified proteins. The network is manually curated using the software ‘Cytoscape’ and protein localization data extracted from this study and from the literature. The shape of the nodes indicates our classification of proteins as known or novel or identified by the MS-screen or the HPA-screen. The colour of the nodes indicates the percentage of metabolic isotope labelling after 20 h (protein turnover). A green node border indicates proteins validated in this study by fluorescence microscopy. For simplicity, each protein is shown with a single localization pattern.

