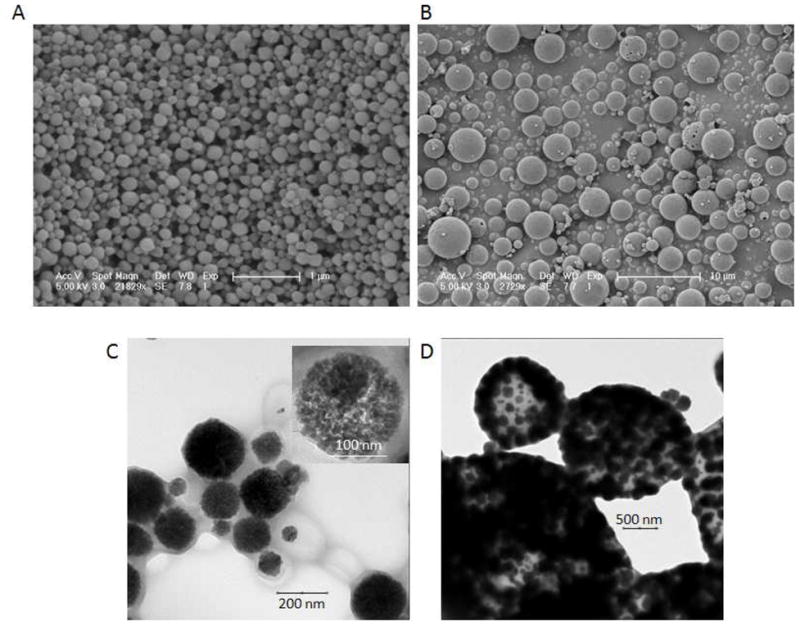
Figure 3.

SEM (A,B) and TEM (C,D) of NPs and MPs. A) NPs and B) MPs had average sizes of approximately 140 nm and 1.7 μm, respectively. The scale bar for NPs is 1 μm and MPs is 10 μm. Note how the particles show a regular, spherical morphology. C) TEM of NPs with the insert showing nanocrystals distributed throughout a single particle. D) TEM of MPs also showing nanocrystals disbursed throughout.
