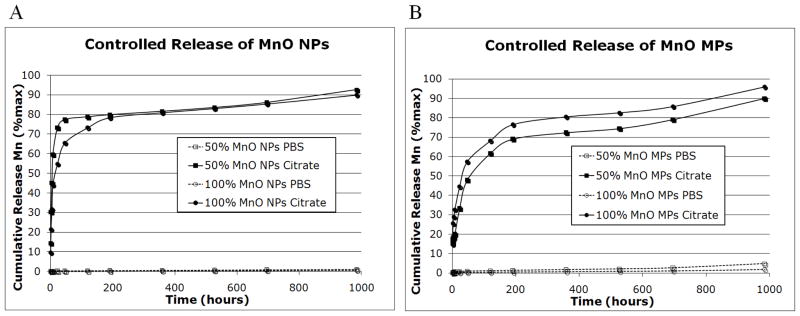
Figure 4.
Controlled release of MnO A) NPs and B) MPs in PBS pH 7 (dashed lines) and 20 mM citrate pH 5 (solid lines). Cumulative release of Mn2+ is shown as % release over time in hours. The total duration of the study was 41 days. Note the significant release of Mn2+ from particles incubated in citrate buffer. The 50% w/w MnO formulations are denoted by square data points, while the 100% w/w MnO formulations are denoted by circular data points.

