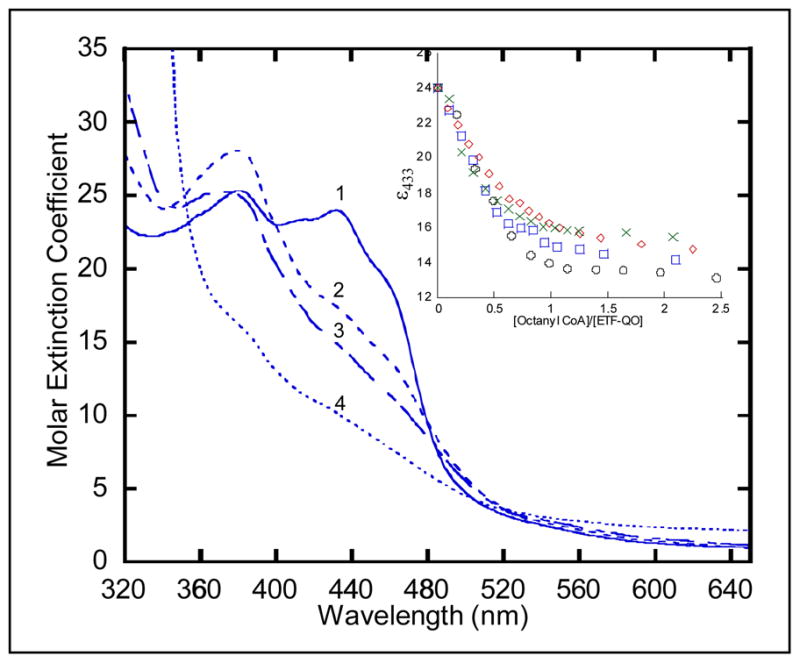
Figure 2.

Anaerobic reductive titration of Y501F ETF-QO. The solution contained ~30 μM R. sphaeroides Y501F ETF-QO, 2 μM human ETF, and 2 μM MCAD in 20 mM Hepes(K+) at pH 7.4. The oxidized sample (spectrum 1) was titrated with octanyl-CoA. Spectra were recorded every 5–10 minutes until less than 0.001 a.u. change per minute in absorbance was observed. The inset shows the Δε433 nm vs. mole ratio of titrant for (○) native, (
 ) Y501F, (
 ) T525A, and (
 ) Y501F/T525A. Spectra 2 and 3 correspond to mole ratios of 0.5:1 and 1:1, respectively, and spectrum 4 is the dithionite reduced sample of Y501F ETF-QO.
