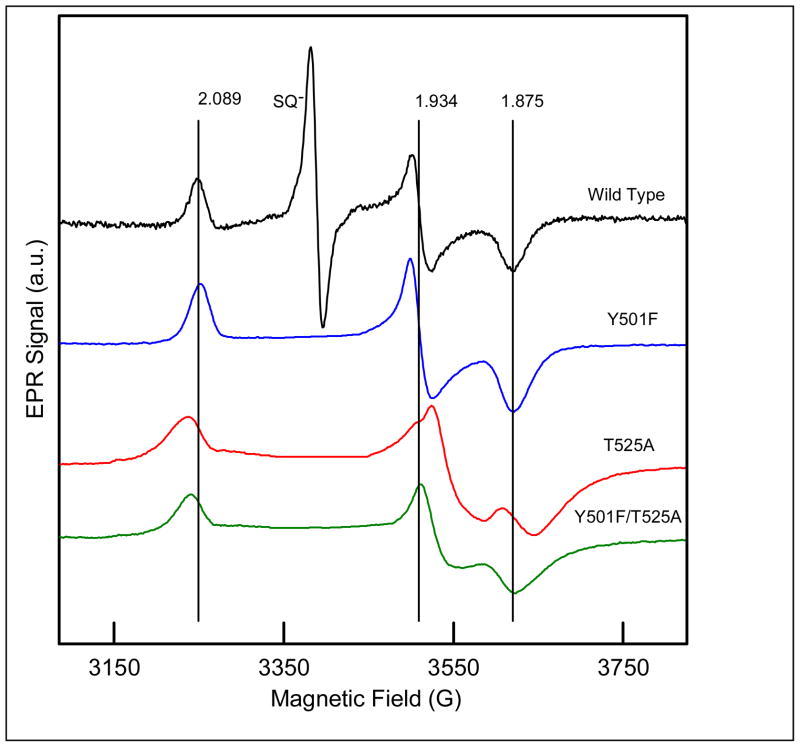
Figure 3.
X-band (9.35 to 9.5 GHz) CW EPR spectra at 15 K of ETF-QO reduced with excess dithionite, recorded with 0.005 mW power. The saturated semiquinone signal was deleted from the spectra of the mutants to aid in comparison. The anaerobic samples contained 50 mM Tris HCl at pH 7.4 and 20% glycerol. The vertical lines are the g-values for native R. sphaeroides ETF-QO.

