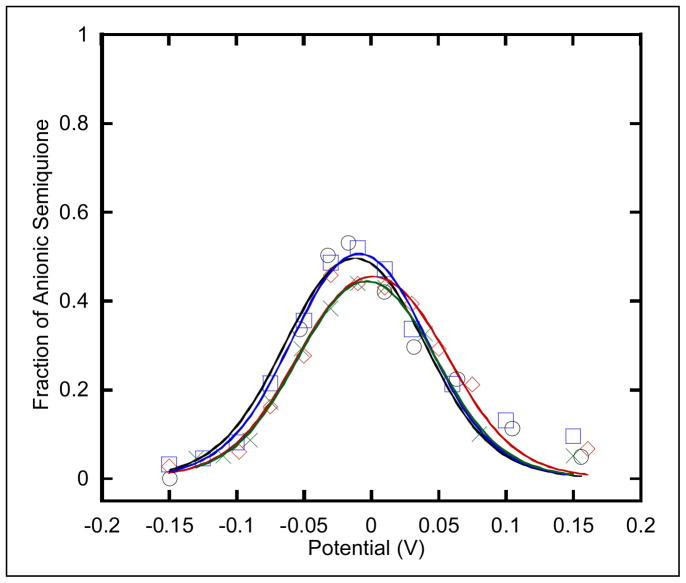
Figure 5.
Potentiometric titration curves are shown of the semiquinone for R. sphaeroides (○) native, (
 ) Y501F, (
 ) T525A, and (
 ) Y501F/T525A ETF-QOs. The semiquinone spectra were recorded at 105 K to avoid saturations of the EPR signal and the midpoint potentials were calculated from Nernst equations described by Paulsen (41).

