
Figure 8.
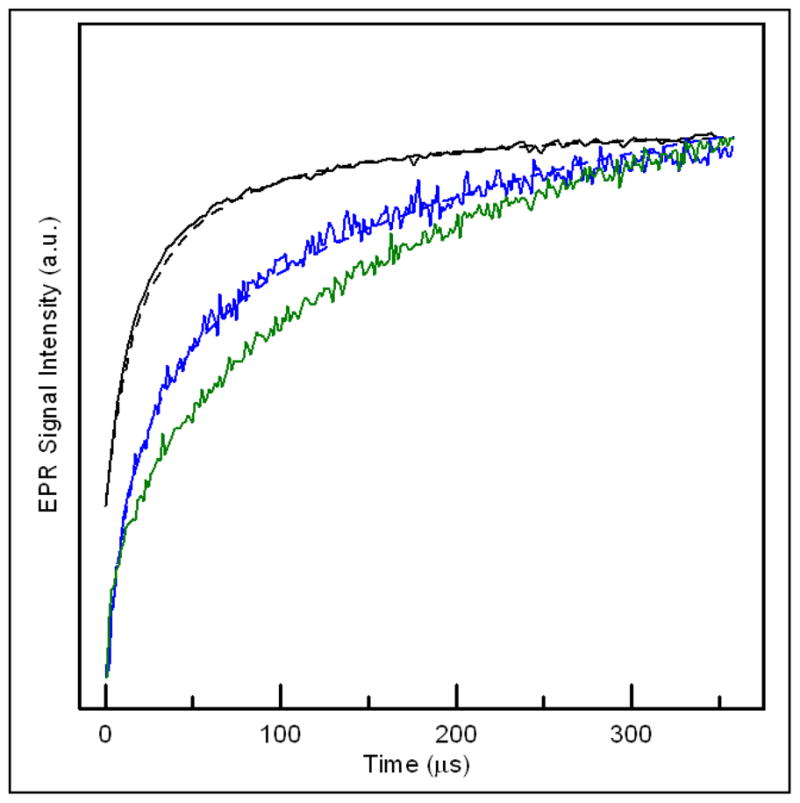
Inversion recovery signals for semiquinone in the enzymatically reduced native (top), Y501F (middle), and Y501F/T525A (bottom) samples of R. sphaeroides ETF-QO at 50 K. The curves are the sums of contributions from semiquinone with neighboring diamagnetic [4Fe-4S]2+ and paramagnetic [4Fe-4S]+. Differences in the inversion recovery curves result from the different populations of paramagnetic [4Fe-4S]+ present: native (~80%), Y501F (25%), and Y501F/T525A (0%). The dashed lines are simulated curves calculated with MENOSR for an average inter-spin distance of ~18.4 ± 1Å.