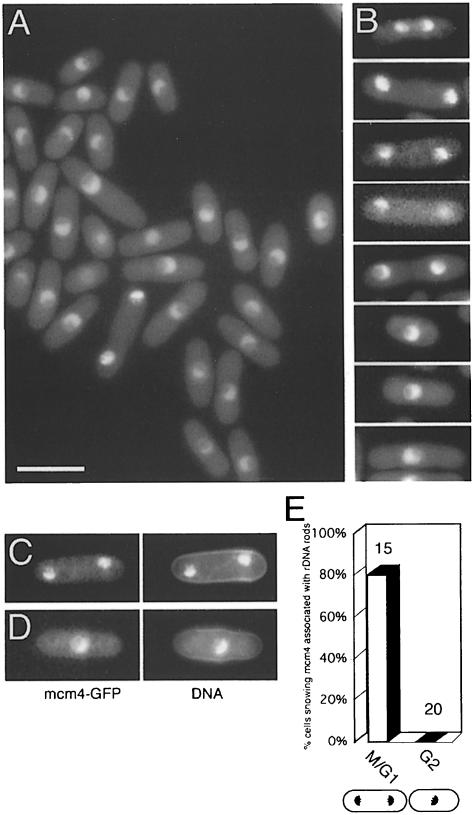
Fig. 1. mcm4 localization in live cells. (A) Mcm4–GFP in strain P560. Bar = 10 μm. (B) mcm4–GFP at different stages of the cell cycle (strain P560). (C and D) mcm4–GFP and DNA (DAPI) images of representative (C) binucleate unseptated (G1 phase) and (D) uninucleate (G2 phase) cells. (E) Percentage of cells showing mcm4 localization to rDNA nucleolar protrusions in binucleate unseptated and uninucleate cells (numbers of cells scored shown above the bars). Cells were only scored if rDNA nucleolar protrusions were visible by DAPI staining.

An official website of the United States government
Here's how you know
Official websites use .gov
A
.gov website belongs to an official
government organization in the United States.
Secure .gov websites use HTTPS
A lock (
) or https:// means you've safely
connected to the .gov website. Share sensitive
information only on official, secure websites.
