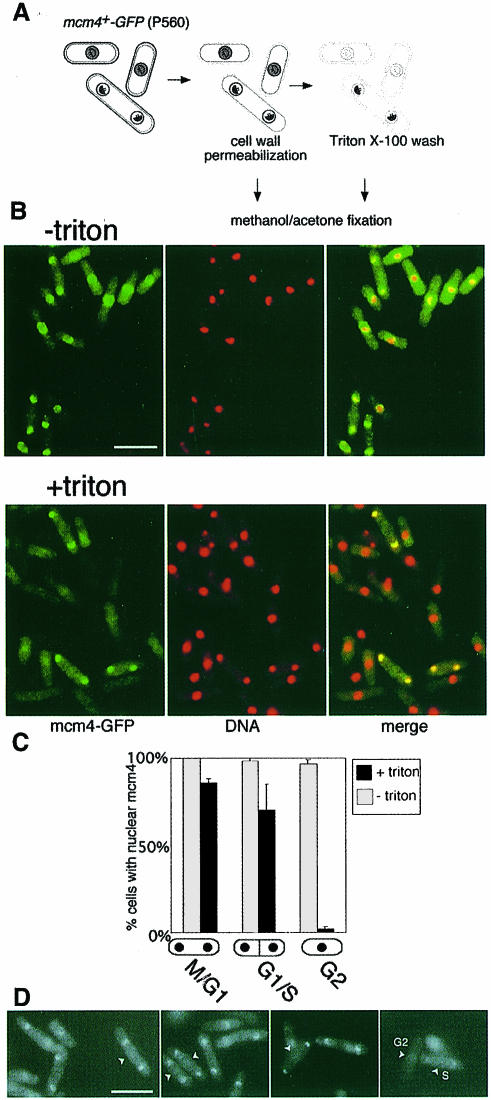
Fig. 2. Chromatin association of mcm4 is periodic during the fission yeast cell cycle. (A) Assay procedure; for details see Materials and methods. Grey shading represents unbound, and black shading represents chromatin-bound mcm4. (B) mcm4–GFP localization (green) and DNA staining (DAPI, red) determined by fluorescence microscopy. In merged images, mcm4-positive nuclei appear yellow. Bar = 10 μm. (C) Proportion of binucleate unseptated, binucleate septated and uninucleate cells with mcm4-positive nuclei before and after extraction with a Triton X-100-containing buffer. (D) Triton-extracted and non-extracted cells were mixed, after labelling of the cell wall of the non-extracted cells with Texas red GS-1 lectin. In this way, the mcm4–GFP signal in both extracted and non-extracted cells can be compared under identical conditions in a single field of view, since the non-extracted cells can be identified by detection of Texas red fluorescence (these cells are marked by arrows). mcm4–GFP intensity, in binucleate unseptated cells, is similar before and after extraction, suggesting that the majority of nuclear mcm4 is chromatin bound in G1 phase. A proportion of binucleate septated cells are fainter than unextracted cells, e.g. cell ‘S’, presumably reflecting partial mcm4 chromatin displacement in mid-S phase; G2 cells are negative, as expected, e.g. cell ‘G2’.

An official website of the United States government
Here's how you know
Official websites use .gov
A
.gov website belongs to an official
government organization in the United States.
Secure .gov websites use HTTPS
A lock (
) or https:// means you've safely
connected to the .gov website. Share sensitive
information only on official, secure websites.
