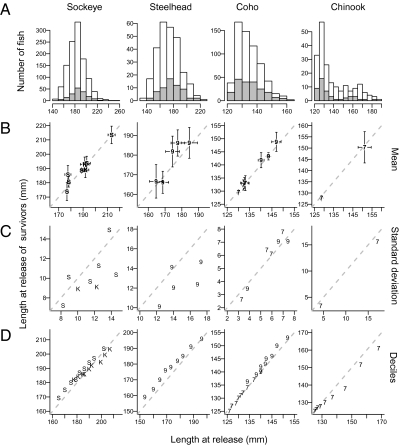
Fig. 5.
Evaluation of possible size-dependent effects of downstream and early marine survival. Plots show summaries of length differences between the tagged smolts at release and the subset of animals surviving to reach distant parts of the array, separated by species. (A) Frequency distribution of fork length at time of tagging for released animals (white) and survivors (gray), with all release groups combined. (B) Mean fork length for individual release groups (±2 SE). (C) SD for individual release groups. (D) Quantile-quantile (qq) plots of the deciles of the empirical length distributions of released fish and survivors (years and stocks are pooled within species and tag size categories). The 1:1 lines are indicated. Individual release groups are identified by an asterisk in Table S1, and consist of all species, stock, hatchery/wild provenance, acoustic tag type, and release year combinations consisting of at least 25 individuals released and at least 10 individuals detected. The smaller V7 and larger V9 acoustic tag types implanted into smolts from these individual release groups are distinguished in the plots by 7 and 9; sockeye (S) and kokanee (K) were all tagged with V9 tags. Individual panels consisted almost entirely of hatchery or wild origin smolts, so these are not distinguished.

