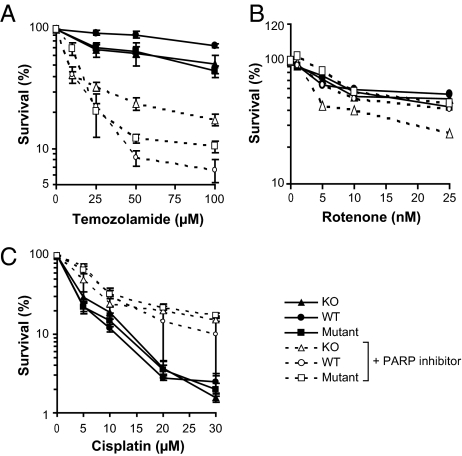
Fig. 3.
Survival curves for cells exposed to (A) temozolamide, (B) rotenone, and (C) cisplatin in the presence or absence of the PARP-1 inhibitor veliparib (50 μM). Note the dose range for rotenone is much lower than used in Fig 2 and does not detect the sensitivity of knockout cells. Circles, wild type H2Ax; triangles, H2Ax knockout; squares, mutant. Solid symbols and lines are cells grown without inhibitor; open symbols and dashed lines are cells grown in veliparib.

