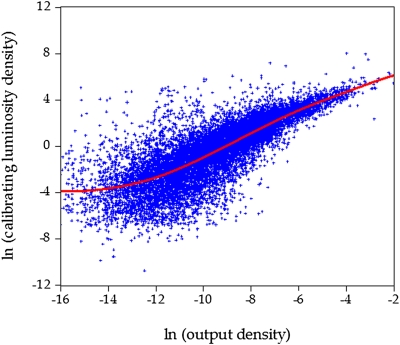
Fig. 2.
Gross cell product (GCP) and luminosity data, all cells. Shown are the scatter plot of log calibrated luminosity for 2006 and log of gross cell product for all 1° × 1° grid cells. Output density is gross cell product (PPP in billions in 2005 international dollars) per square kilometer. Luminosity density per square kilometer is the radiance calibrated luminosity for 2006. All grid cells (n = 12,393) are included. The solid line is the kernel estimator using an Epanechnikov kernel and 100 grid points per kernel.

