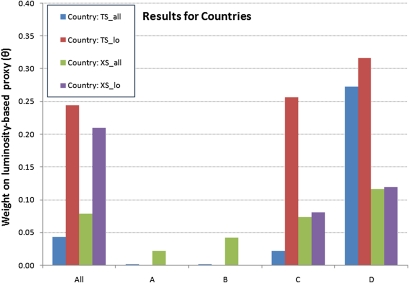
Fig. 3.
Summary estimates of the value of θ or the weight on luminosity for countries of different grades. Shown is the estimated optimal weight (θ) for the both 17-y growth rate (TS) and cross-sectional data (XS) for countries. Blue and green bars indicate the values of θ for all countries, and red and purple bars indicate estimates for low-GDP density countries only. The sample size for the E countries is too small to be statistically reliable.

