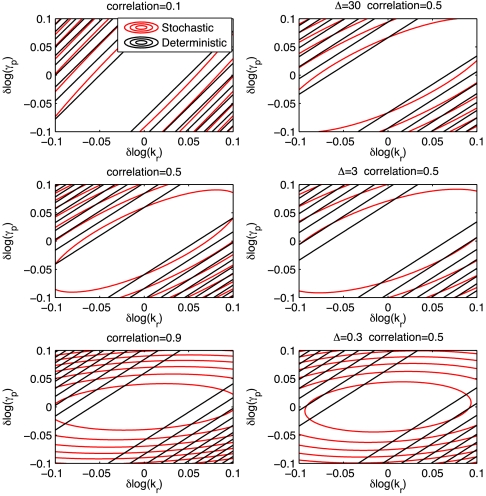
Fig. 2.
Neutral spaces for TS and DT versions of the model of single gene expression for logs of parameters kr and γp. (Left) Differences resulting from RNA, protein correlation: ρrp = 0.1 (Top) ρrp = 0.5 (Middle), ρrp = 0.9 (Bottom). Correlation 0.5 corresponds to parameter set 3 from Table S1 and was varied by equal-scaling of parameters kp, γp. (Right) Differences resulting from temporal correlations. We assumed n = 50 and tuned correlation between observation by changing sampling frequency Δ = 0.3 h (Left) Δ = 3 h (Center) Δ = 30 h (Right). Set 3 of parameters was used (Table S1).

