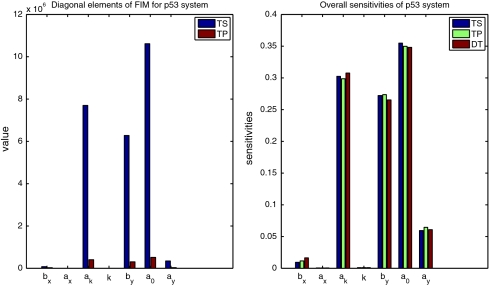
Fig. 3.
(Left) Diagonal elements of FIM for TS and TP versions of p53 model. Values of FIM for DT verison are not presented as they can not be compared with those for stochastic models. (Right) Sensitivity coefficients  for TS, TP, DT version of p53 model. FIMs were calculated for parameters presented in Table S4.

