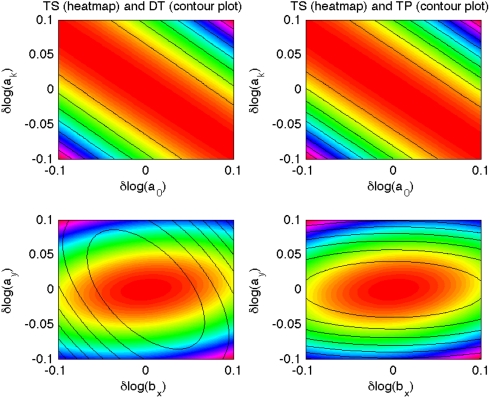
Fig. 4.
Neutral spaces for TS, TP, and DT versions of p53 model for logs of two parameter pairs (a0,ak) and (bx,ay). The left column presents differences resulting form general variability, correlations between species and temporal correlation (comparison of TS and TP models). The right column shows differences due to variability and correlation between species (comparison of TS and TP models). The top row is an example of parameters for which differences are negligible, bottom row presents a parameter pair with substantial differences. FIM was calculated for 30 measurements of all model variables and Δ = 1 h.

