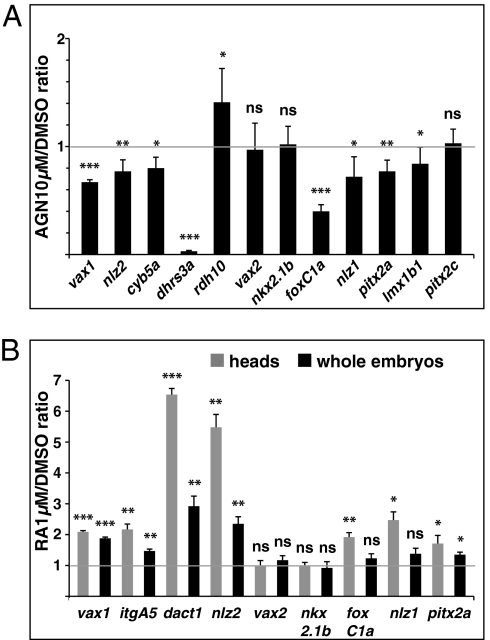
Fig. 4.
Quantification of gene expression changes after manipulations of RAR signaling. (A and B) Real-time PCR quantification of gene expression in 31- to 33-hpf dissected heads (A) or 25- to 28-hpf dissected heads and whole embryos (B) after treatments with the indicated reagents from 3s, shown as the mean ratio between AGN or RA and DMSO conditions in six (A) or three (B) biological replicates. Error bars show SDs. *P < 0.05; **P < 0.01; ***P < 0.001; ns, nonsignificant (P ≥ 0.05) according to two-tailed Student's t test.

