Fig. 3.
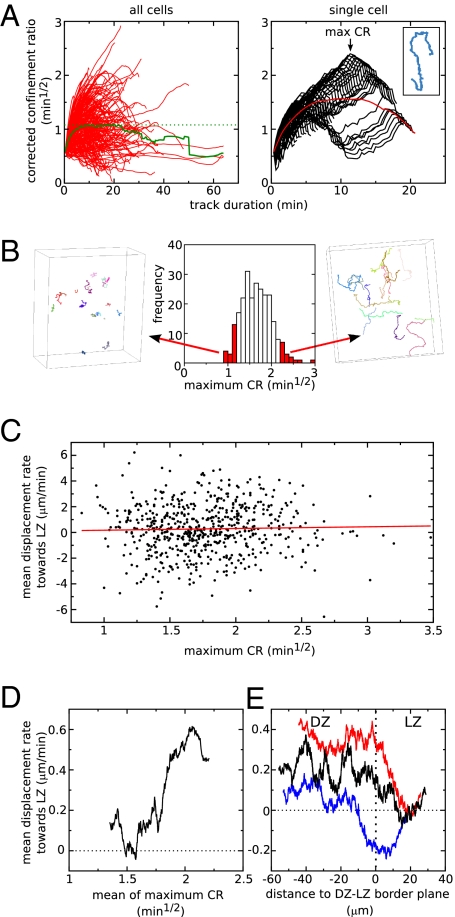
Preferential migration from DZ to LZ is overrepresented within a large subset of straight moving cells. (A) The corrected confinement ratio (CR) as a function of track duration. (Left) The red lines represent the different tracks in an experiment, and the green line gives the average behavior of all cells. (Right) Demonstration of how the maximum CR is calculated for the example track shown in the Inset. Each black line represents the CR for one particular part of the track, and the maximum of all these lines is the maximum CR (denoted by arrow). The red line represents the average CR for this particular cell (i.e., this is one of the red lines on the Left. (B) The frequency distribution of maximum CR values for all cells in one experiment and the corresponding tracks for two subselections of the cells. (C and D) Mean displacement rate toward the LZ in the straightest part of the track as a function of the maximum CR value of the cell. In C, each dot represents one cell (red line represents a linear regression), whereas in D, running averages of 200 cells are presented. (E) The mean displacement rate toward the LZ as a function of the distance to the DZ–LZ border plane for a subpopulation with relatively straight tracks (red line, cells with max CR values above 1.75 min1/2) and for one with relatively condensed tracks (blue line, cells with max CR values below 1.75 min1/2). For comparison, the behavior of the entire B-cell population is plotted in black (same as Fig. 2F). Lines are running averages of 3,000 movement steps. The horizontal dotted line in D and in E gives the expected mean value for the displacement rate toward LZ in a randomly migrating population.

