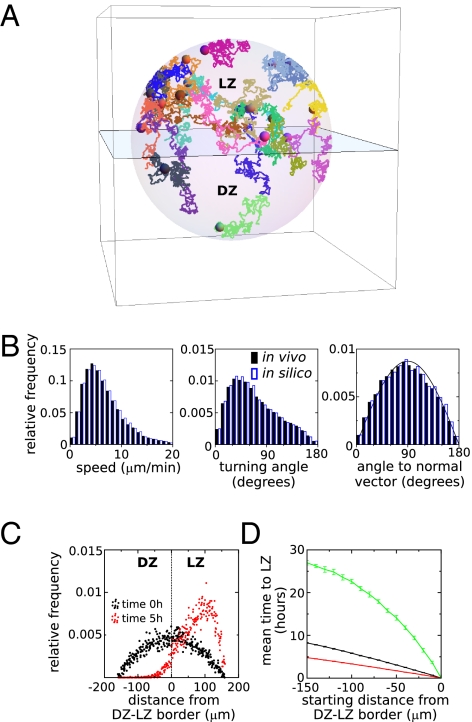
Fig. 4.
Modeling shows that directed B-cell migration from DZ to LZ strongly affects the time to reach the LZ. (A) Example of 20 in silico cells migrating in a simulated GC. The plane represents the border separating LZ and DZ. (B) Comparison of the experimentally measured and simulated distributions of speed, turning angle, and angle to the vector normal to the DZ–LZ border pointing toward the LZ. Note that the latter distribution deviates only slightly from the distribution expected for random migration (denoted by the solid line). (C) The spatial distribution of simulated cells in 10 simulations at the beginning and at the end of a 5-h simulation. Each dot represents the relative frequency of cells within distance bins of 10 μm wide in a single simulation of 1,000 cells. (D) The mean time to reach the LZ when starting at various depths within the DZ of the simulated GC. Simulations are either based on all DZ migration data (green and black line) or on the DZ migration data of B cells with straight tracks (maximum confinement ratio 1.75 min1/2, red line). Simulations either incorporate the directed migration as observed experimentally (black and red line) or are based on random migration with similar speeds and turning angles as in the experimental data (green line). Error bars denote SD of the mean.

