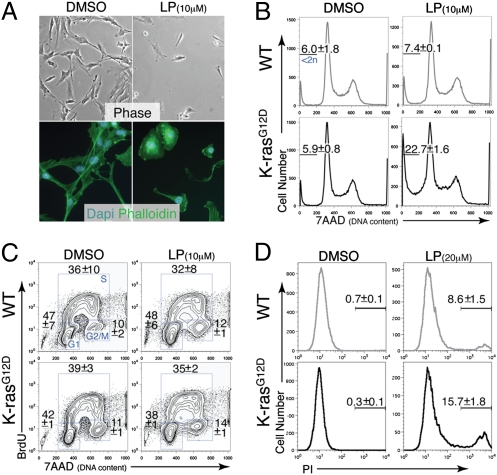
Fig. 2.
Lanperisone induces cell death of oncogenic K-ras–expressing MEFs. (A) Morphological changes induced by LP treatment of K-rasG12D-expressing MEFs. Phase contrast (Upper) and Oregon Green 488 phalloidin fluorescence (Lower) are shown. (B) Enhanced cell killing of K-rasG12D-expressing MEFs compared with wild-type MEFs, as assessed by FACS for DNA content. Percentages are the mean ± SD of three independent MEF lines. (C) Cell cycle analysis of LP vs. DMSO-treated MEFs. Percentages are the mean ± SD of three independent MEF lines. (D) FACS for PI. Percentages are the mean ± SD of three independent MEF lines. For all experiments shown, K-rasG12D-expressing MEFs were derived from K-rasLSL-G12D;Mox2-Cre embryos. Cells were treated with LP or DMSO for 6 h. Similar results were observed with K-rasG12D;p53−/− MEFs.

