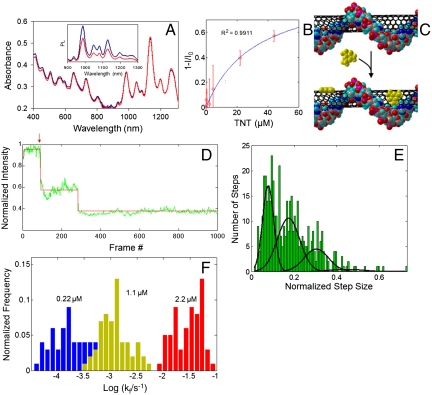
Fig. 6.
Single-molecule, reversible excitonic quenching of ss(AT)15–SWNT by TNT. (A) Absorption spectra of ss(AT)15–SWNT before (blue) and after (red) introduction of 44 μM TNT. (Inset) PL spectra under same conditions. (B) Langmuir adsorption isotherm of TNT binding to the ss(AT)15-encapsulated (8,7) SWNT species. (C) Depiction of direct TNT binding to the SWNT surface of the ss(AT)15–SWNT complex. (D) Single-molecule TNT detection by ss(AT)15–SWNT complexes bound to glass. The trace shows the PL of a single complex acquired under 658-nm excitation. TNT (220 nM) was added at frame 100 (red arrow); one frame was acquired every 500 ms. Intensity fluctuations were fit by an error-minimizing algorithm (red). (E) A histogram of fitted intensity fluctuations from multiple nanotube intensity traces upon exposure of SWNT to 1.1 μM TNT. The histogram, fit by a series of Gaussian curves, elucidates quantization into single, double, and triple steps. (F) Histogram of quenching rates of individual nanotubes exposed to three different concentrations of TNT.

