Fig. 3.
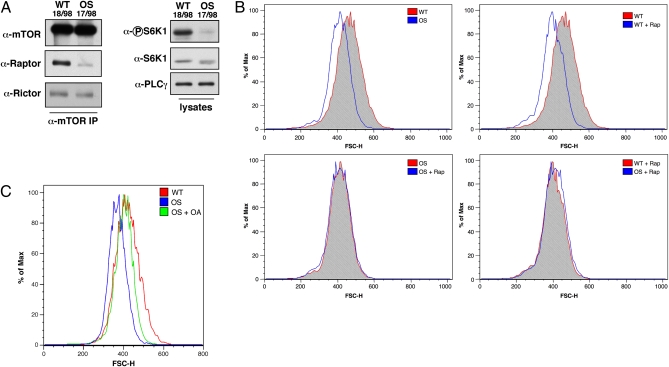
mTORC1 function is reduced in OS patient cells. (A) α-mTOR immunoprecipitates and whole cell lysates from WT (18/98) or OS (17/98) fibroblasts were immunoblotted with the indicated antibodies. (B) WT and OS cells were fixed and labeled with propidium iodide before FACS analysis. Rapamycin treatment (100 nM) for the indicated samples was for 18 h. For all samples, the G1 population was gated and the forward scatter height (FSC-H) was determined. Histogram plots were generated using FlowJo version 8.8.6. (C) As indicated, OS cells were treated with okadaic acid (OA,10 nM) for 18 h before fixation and propidium iodide labeling. For WT, OS, and OS cells treated with okadaic acid, the G1 population was gated and the FSC-H was determined. Histogram plots were generated using FlowJo.

