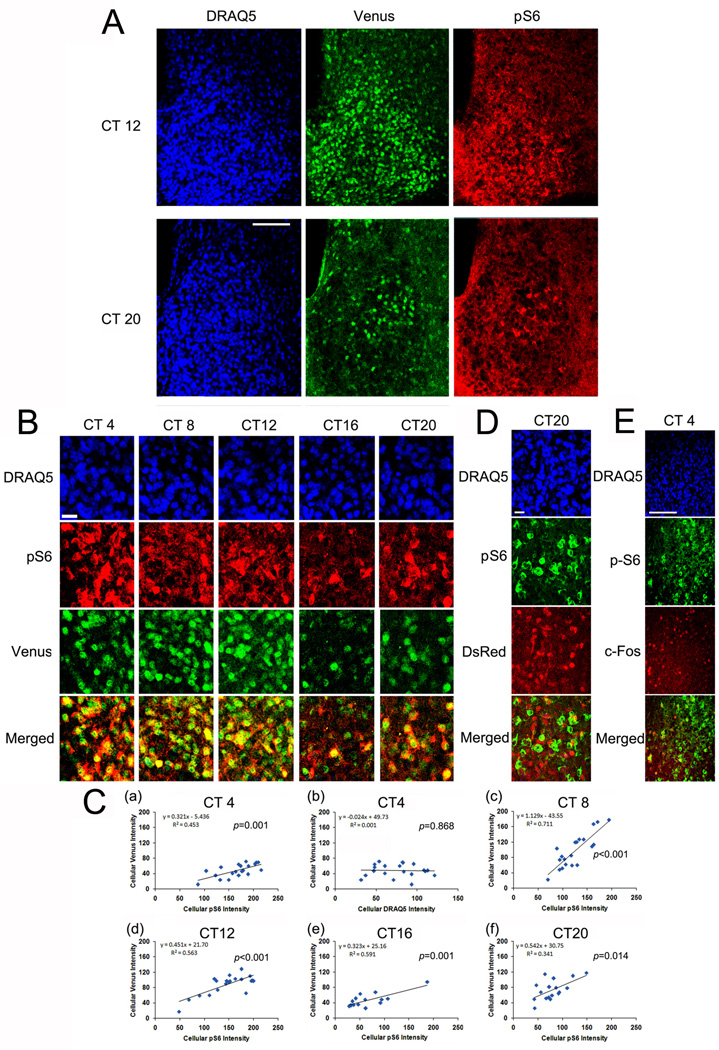
Figure 3. Colocalized expression of pS6 and per1-Venus in the SCN.
Entrained animals were dark-adapted for 2 d and then killed under dim red light at 4 h intervals over a 24 h cycle. A, Representative confocal microscopic images of triple immunofluorescence labeling for pS6 (red), Venus (green) and DRAQ5 (blue) at CT12 and CT20. B, High magnification images of the central SCN as a function of circadian time: the pS6 and Venus channels are merged (bottom panels). Note the cellular level correlation between pS6 and Venus expression (revealed by a yellow cellular-level hue). Scale bar: 15 microns. C, Linear correlation analysis of cellular Venus and pS6 expressions at CT4 (a), CT8 (c), CT12 (d), CT16 (e) and CT20 (f). The Y-axis denotes normalized fluorescence intensity (0–255 scale) of Venus and the X-axis denotes normalized fluorescent intensity of pS6. As a control, the relationship between Venus (Y-axis) expression and DRAQ5 (X-axis) labeling at CT4 is shown in C(b). Each dot represents a single cell. The significance (p value) for Pearson's correlation analysis is shown in each panel. D, Central SCN tissue isolated at CT 20 was immunolabeling for pS6 and per2-DsRed. Of note, the merged panel (bottom) reveals little cellular colocalization between the two antigens. This lack of concordant labeling is in contrast to the colocalized expression between pS6 and Venus. Scale bar: 15 microns. E, Central SCN tissue isolated at CT 4 was immunolabeled for pS6 and c-FOS. Of note, the merged panel (bottom) reveals that the majority of pS6-postive cells do not express c-FOS. Scale bar: 100 microns.

