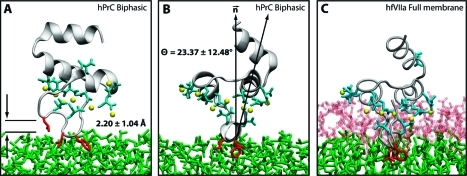
Figure 7.
Depiction of the hPrC GLA domain at t = 29 ns. In this figure, the green represents DCLE, the white represents water, the protein backbone is depicted in gray, and the keel residues are shown in red. (A) Figure shows a side view of the GLA domain with its average height above the interface of 2.20 ± 1.04 Å. (B) Figure shows a front view of the GLA domain together with the interface normal and the defined protein axis; the equilibrium angle of the protein was found to be 23.37 ± 12.48°. (C) A front view of the fully inserted hFVIIa GLA domain.(21) (B) and (C) demonstrate that the equilibrium structure of the inserted GLA domain using the biphasic solvent system is comparable to the structure obtained using an all-atom representation of the membrane.

