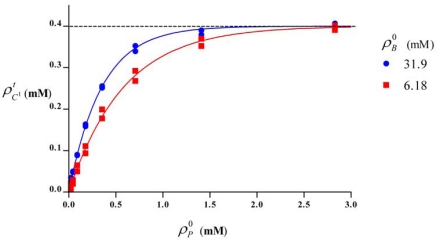
Fig. (3).
Relation between the molar concentrations of total cuprous ions and the initial protein concentration . The points were calculated by Eq. (7) from experimental data, using the determined values of K1 and K2 in Table 1 for two initial BCA concentrations of 6.18 and 31.9 mM. The fitted curves were calculated by Eq. (8) were also plotted (lines). The data for high protein concentration are not shown.

