
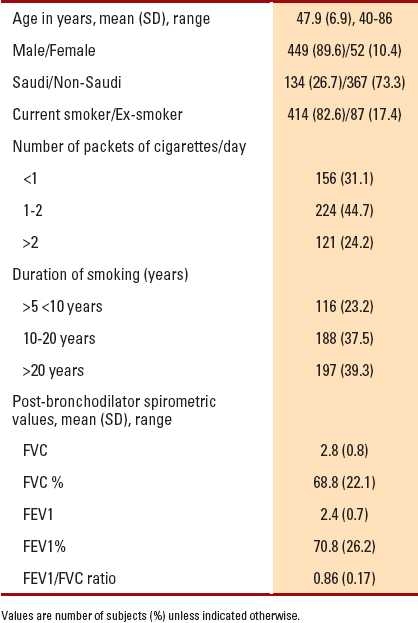
Table 1.
Frequency distribution and mean spirometric values for the study population (n=501).
Official websites use .gov
A
.gov website belongs to an official
government organization in the United States.
Secure .gov websites use HTTPS
A lock (
) or https:// means you've safely
connected to the .gov website. Share sensitive
information only on official, secure websites.
Frequency distribution and mean spirometric values for the study population (n=501).