Figure 5.
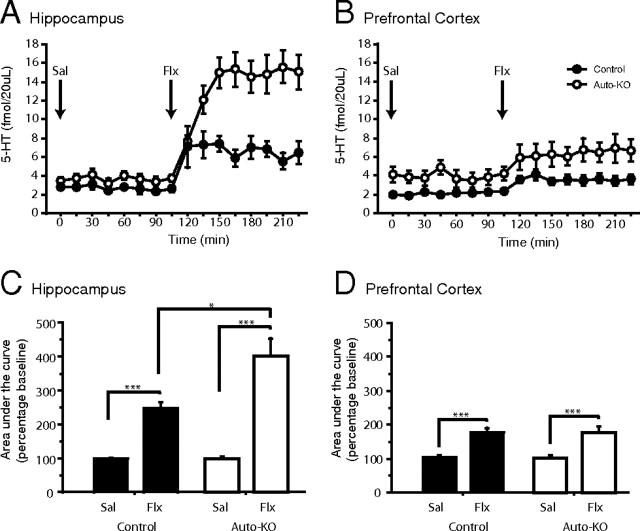
A, B, Extracellular serotonin levels measured by in vivo microdialysis in the vHPC (A) and PFC (B) following injection of saline (Sal; t0) and 18 mg/kg fluoxetine (Flx; t105). Values are mean ± SEM for each time point. C, D, Total extracellular serotonin, measured by area under the curve analysis compared with baseline, increases in the vHPC (C) and PFC (D) of both auto-KO and control mice in response to acute fluoxetine treatment. Auto-KO mice display a larger percentage increase than controls in response to fluoxetine in the vHPC but not in the PFC. Values are ± SEM (n = 7–9 mice/group). *p < 0.05, ***p < 0.001.

