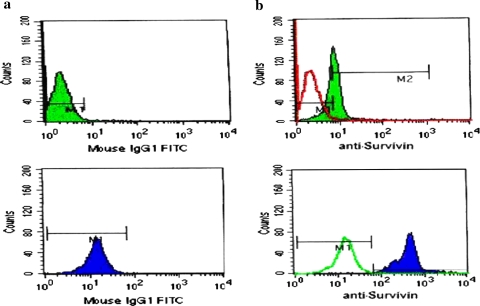
Fig. 1.
Histograms of two ALL cases, the above case: (a) shows the isotypic control, (b) the isotypic control (transparent curve) overlapped with the survivin expression in this case (opaque) (Survivin is negative). The second case: (a) shows the isotypic control, (b) the isotypic control (transparent curve) overlapped with the survivin expression in this case (opaque) (Survivin is positive)

