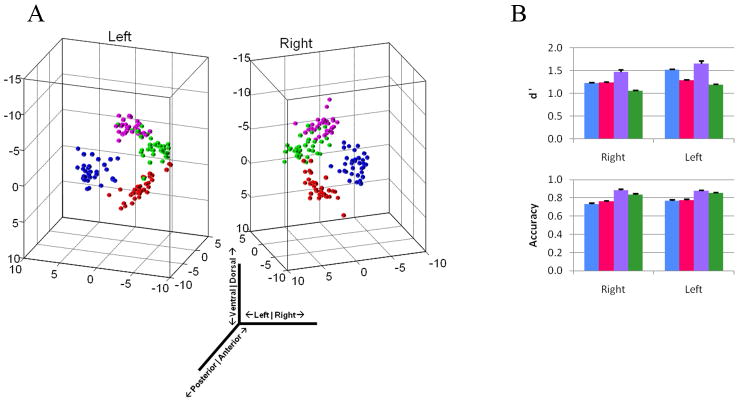
Figure 3. Overlap of tractographic segmentation-based nuclei between subjects.
a, Resulting centroid locations, after alignment (see methods), of the segmented nuclei are plotted from 35 subjects, demonstrating the similarity of nucleus location, in three dimensions. Nuclei are color-coded as in Figure 1. b, Right- and left-amygdala tractographic segmentation was consistent among 35 subjects, as indicated by high d′ and accuracy values.

