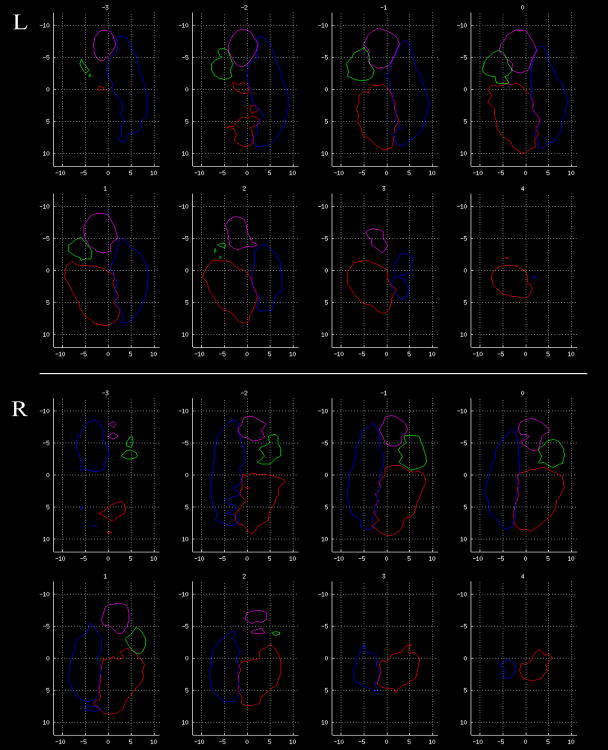
Figure 4. Amygdala tractographic segmentation atlas.
Coronal slices through the population’s left (top panels) and right (bottom panels) amygdalae, from posterior to anterior, in rotated space. The edges of the group probability maps, thresholded at >= 15/35 subjects, are shown for each subregion (color-coded as in Figure 1). Units are in millimeters, and with respect to the amygdala centroid. The reference point for rotation (4th ventricle) is posterior and normal to the plane for all subjects.

